Generate a new report and create a chart using the data in your Salesforce org. In this example, we create a report on Entities with Investors.
Steps to Create a Report:
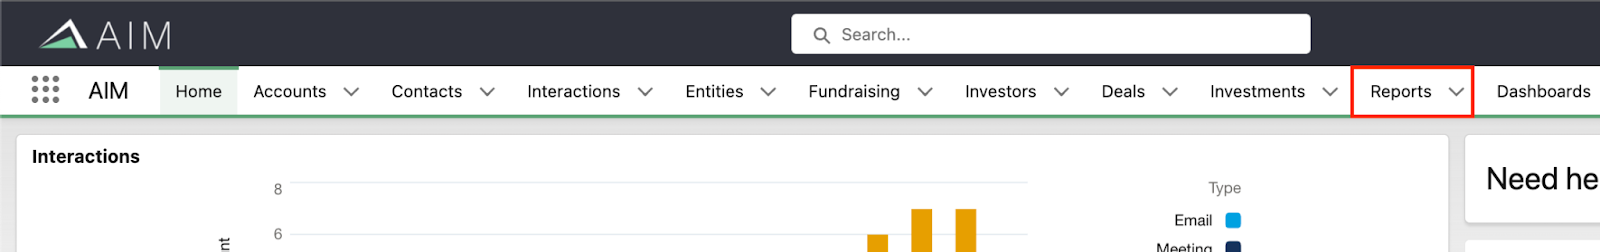
- In AIM, click the ‘Reports’ tab in the navigation bar.
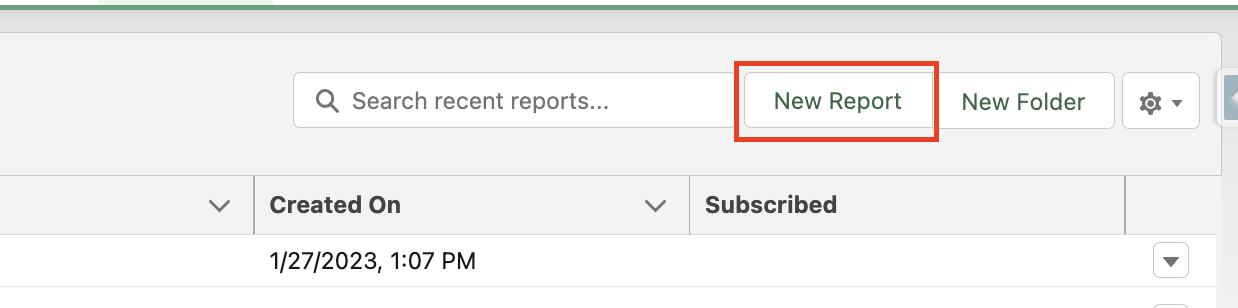
- Once on Reports, click ‘New Report’.
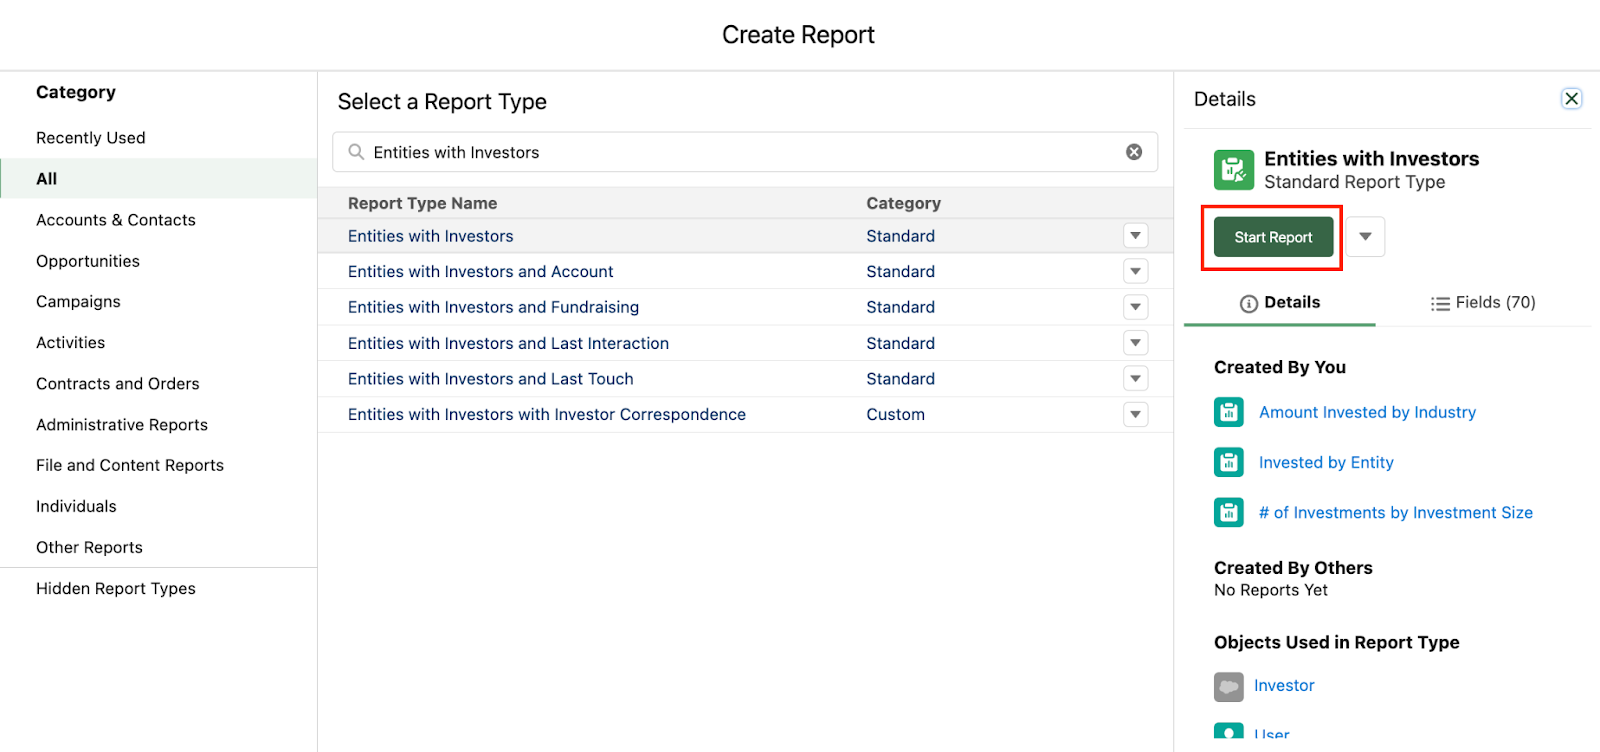
- Choose the Report Type that corresponds with the data you’d like to report on. Click ‘Continue’ at the bottom right of the page. In this example, we are choosing ‘Entities with Investors’.
- Select the ‘Filters’ tab, and start typing in the field you want to filter by. In this example, ‘Account Country’ equals ‘USA’.
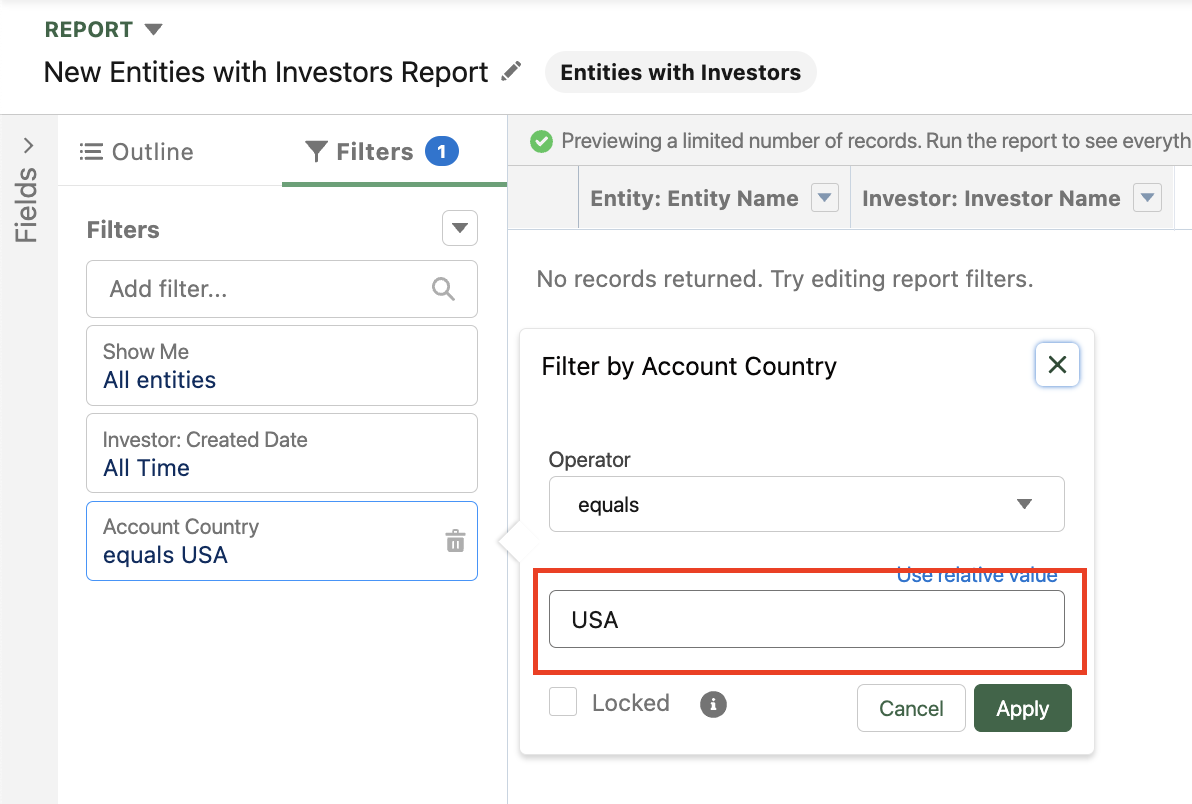
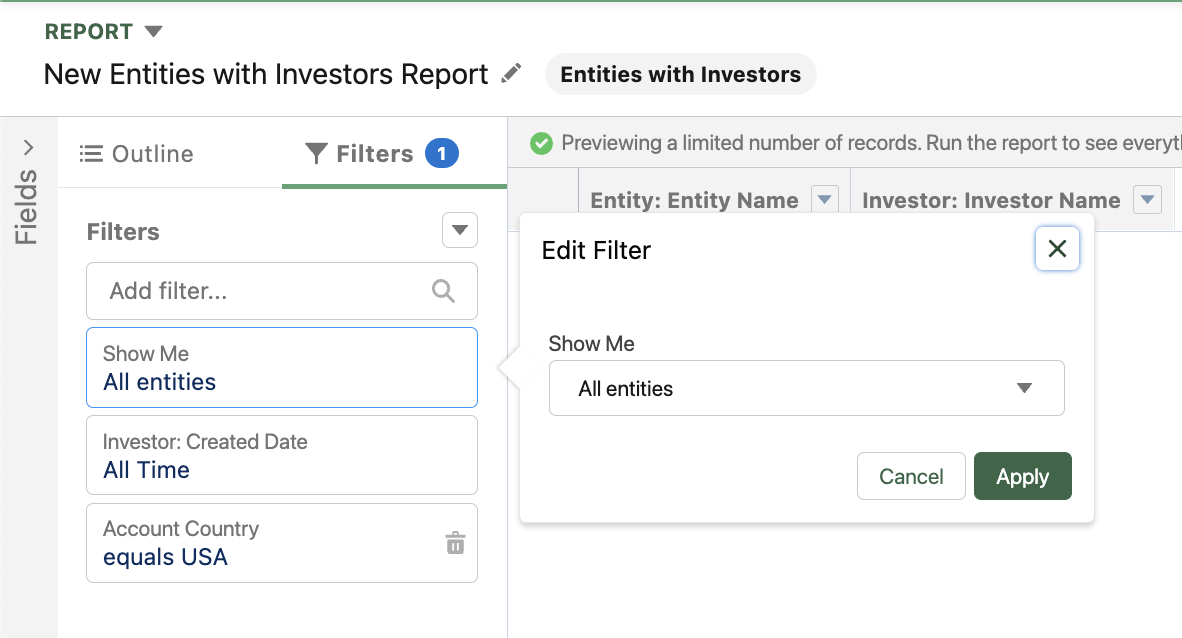
- Select ‘Show Me’ and change to ‘All Entities’
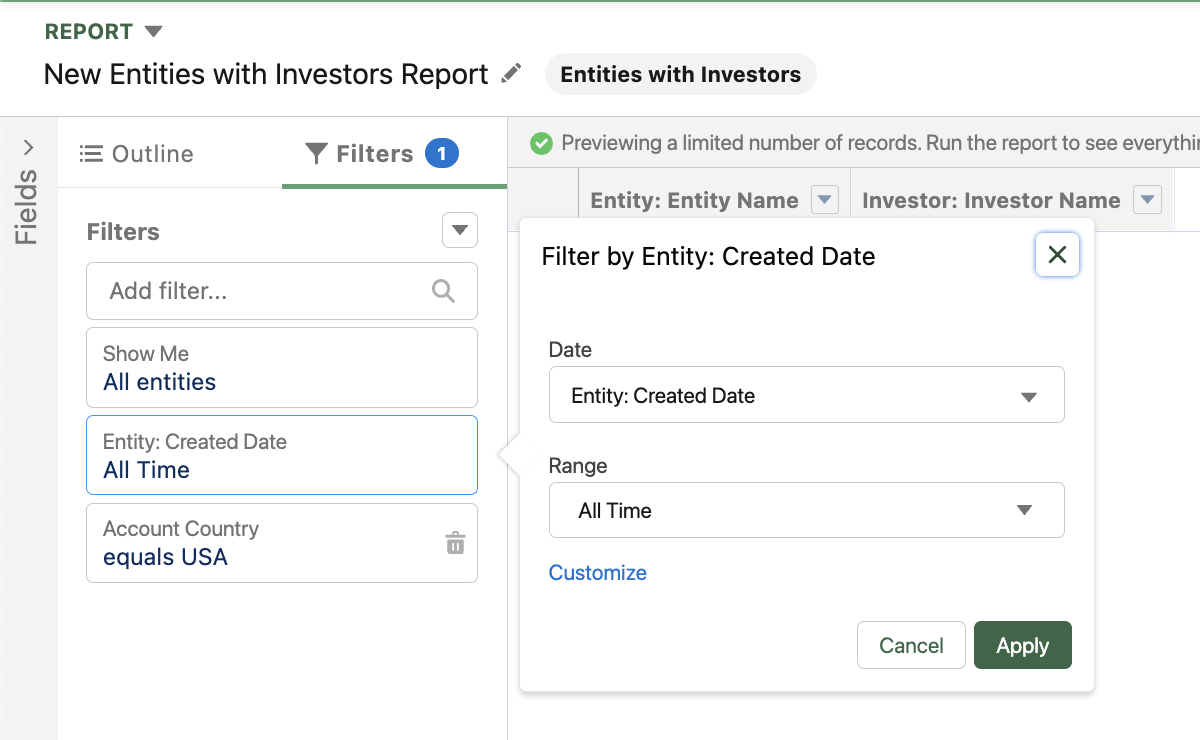
- Select ‘Investor: Created Date’ and change to ‘All Time’
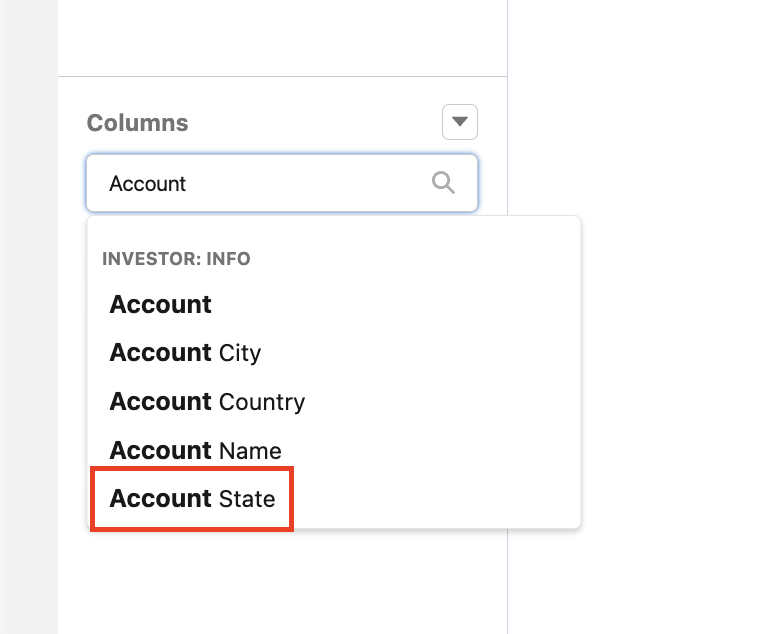
- Navigate to the ‘Outline’ tab in the report builder, and add a new column by typing in ‘Account State’
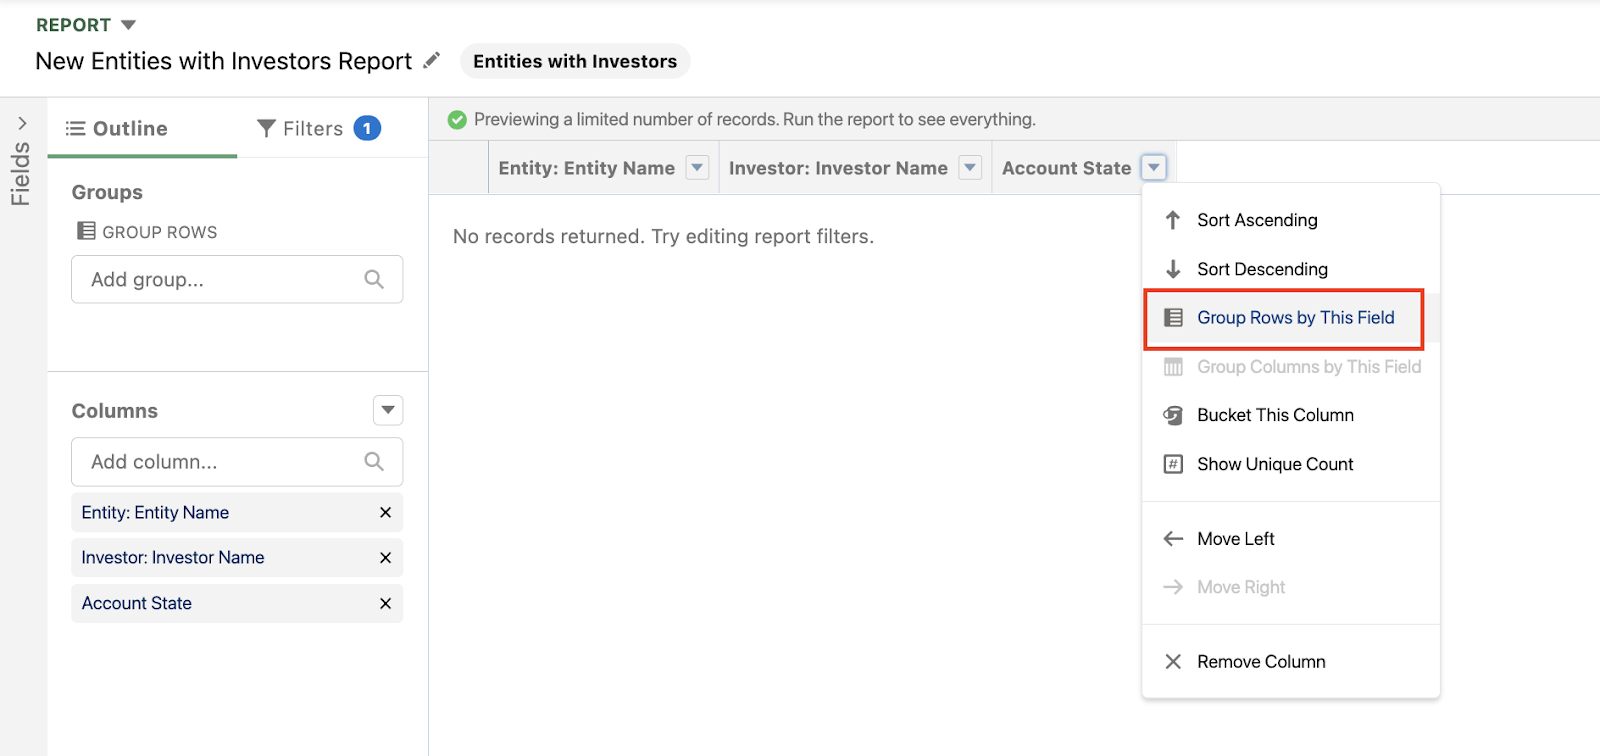
- To group by this newly added column, head to the column in the report builder and click the caret next to the column name. Select ‘Group Rows by This Field’
Steps to Add a Chart to a Report:
Note: You can add a chart to any report that’s grouped by rows (summary report) or rows and columns (matrix report).
- Navigate to the report that you would like to add a chart on.
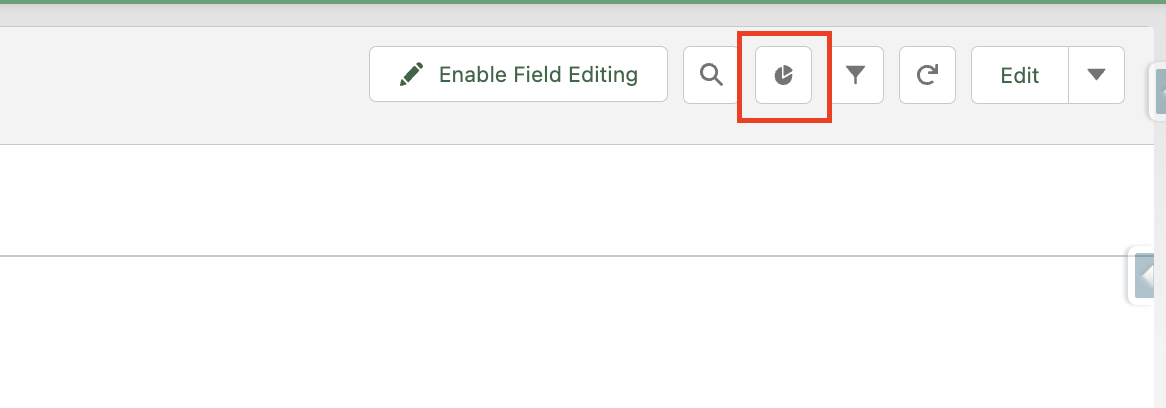
- Click the ‘Toggle Chart’ icon.
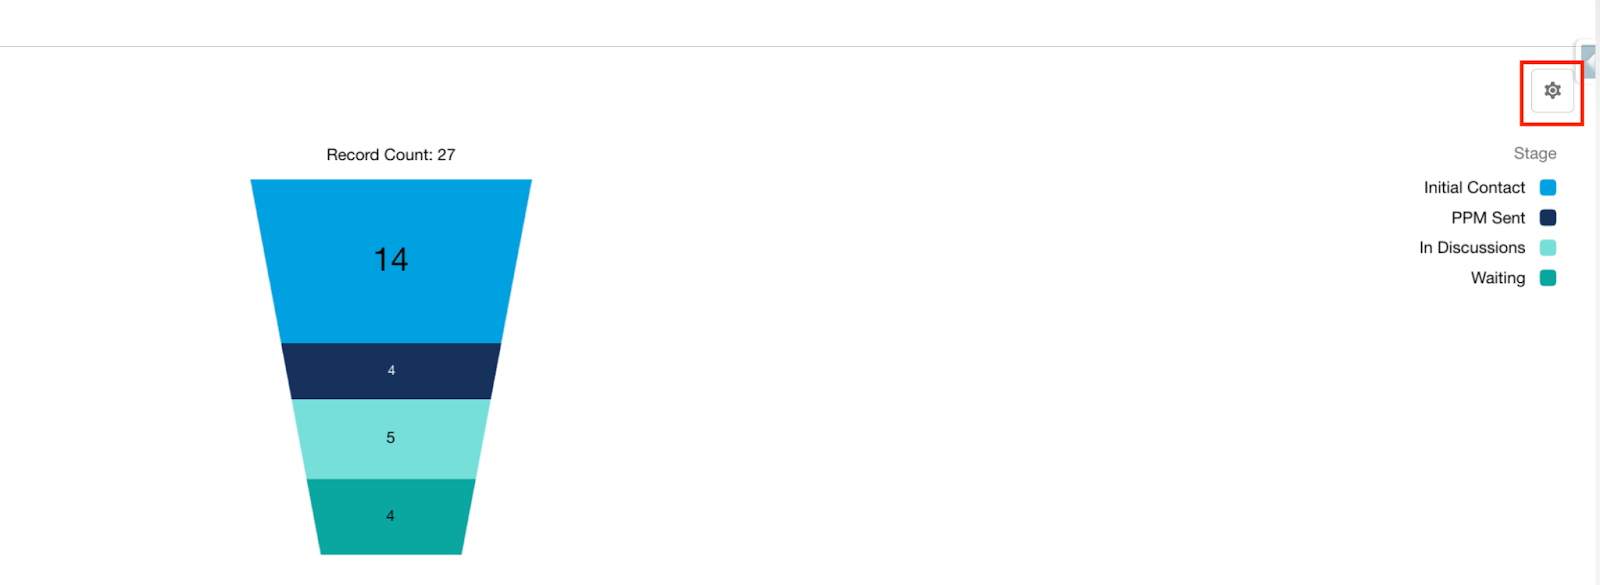
- A chart will automatically be generated based on the setup of the report.
- If you want to change this automatically generated chart, select the gear icon in the chart area.
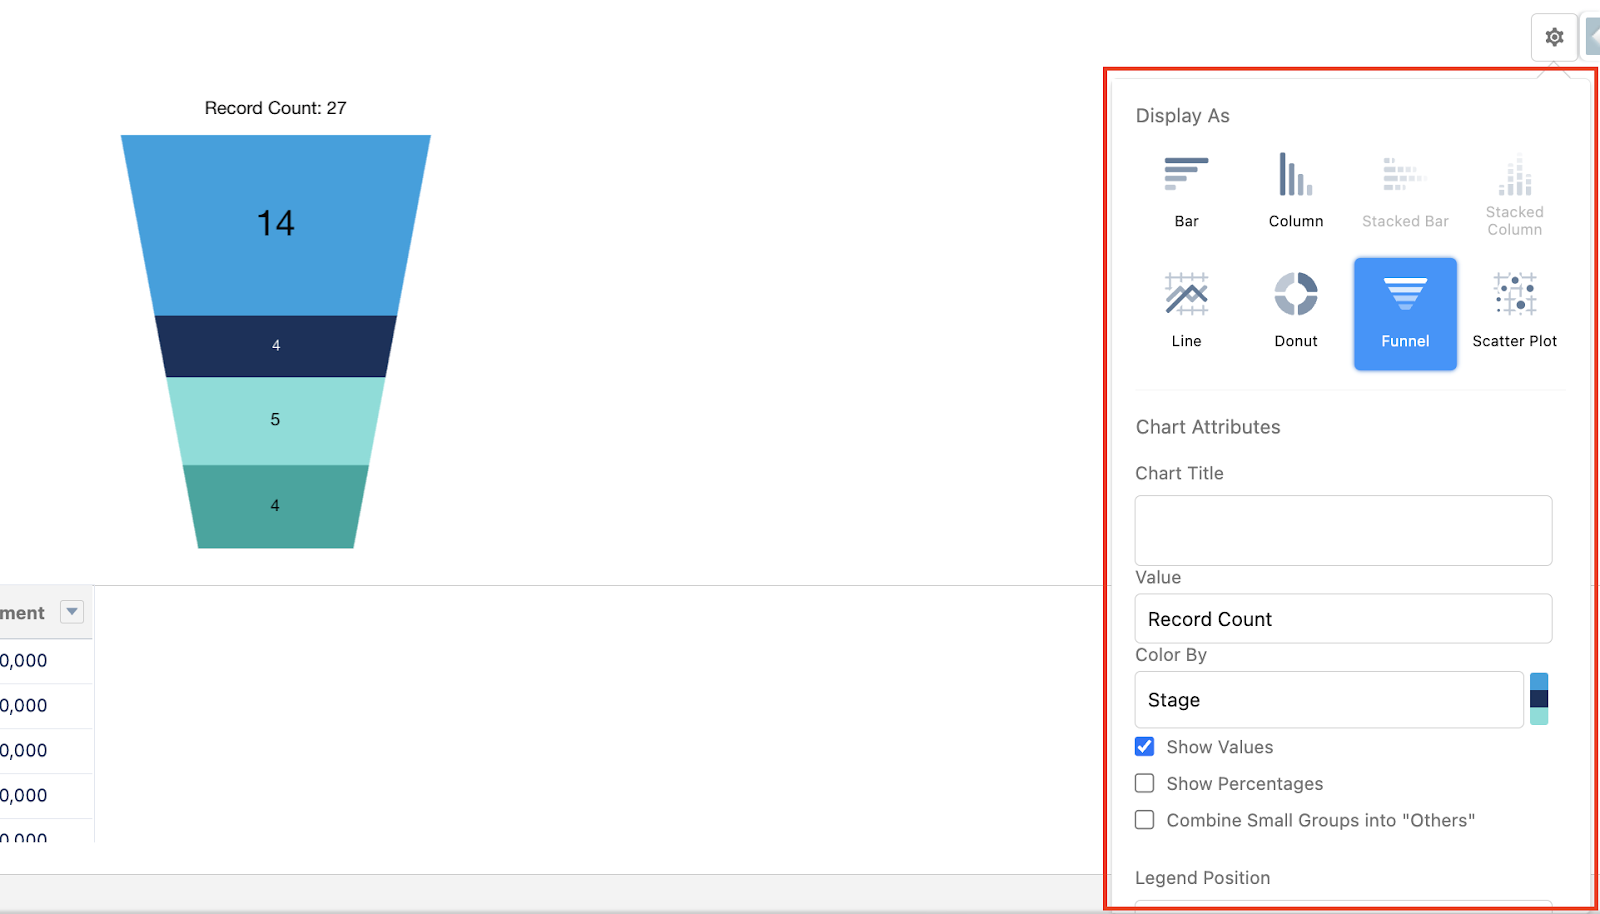
- A drop-down will appear that will give you the option to make edits to the chart that was created.
6. Make sure to ‘SAVE’ the report once you have added a chart.