
Dashboards in the CRM allow you to visualize and analyze data from reports in a customizable layout. This article walks you through creating, editing, and updating dashboards.
Creating a Dashboard:
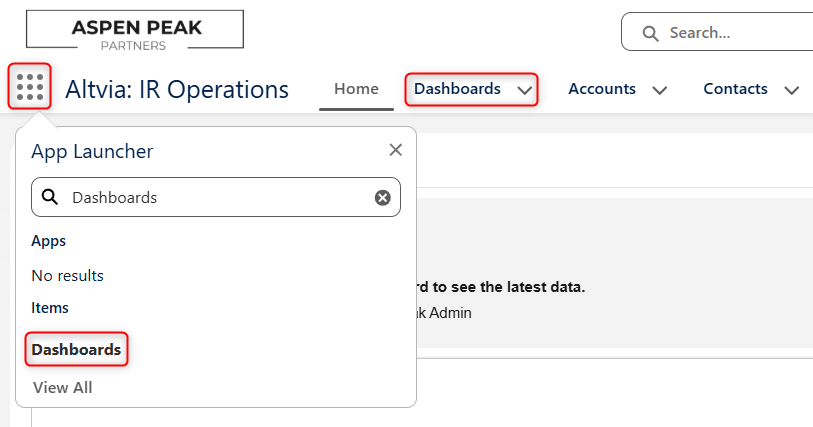
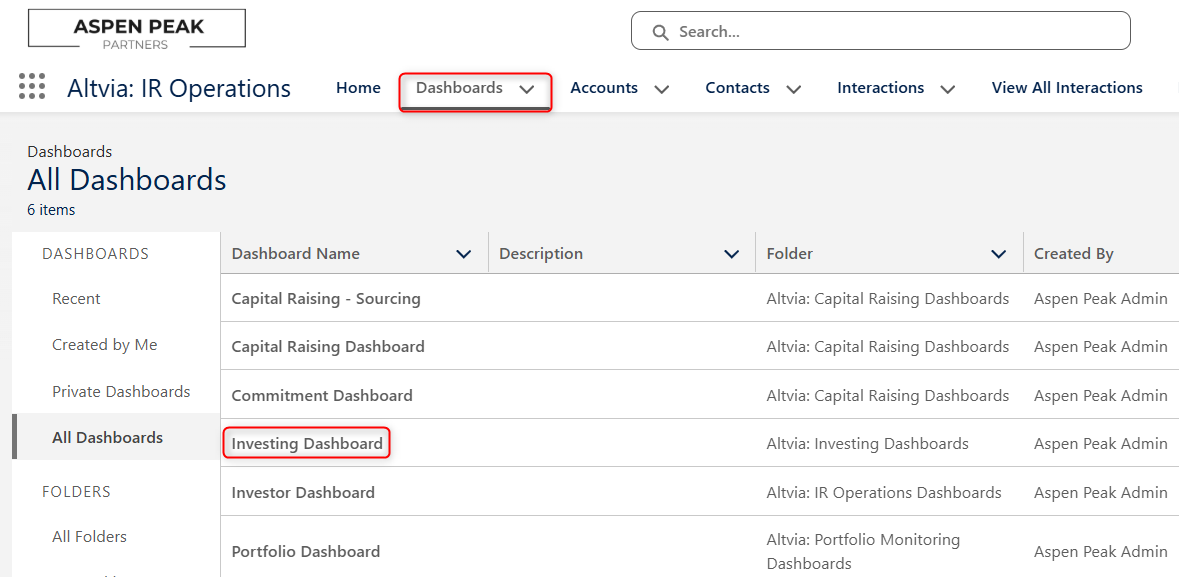
- Navigate to Dashboards
- From the CRM home screen, click on the ‘Dashboards’ object or search for and select ‘Dashboards’ in the App Launcher.
- Create a New Dashboard
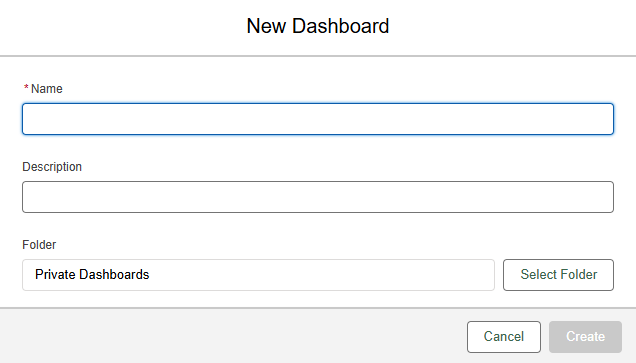
- Click the New Dashboard button.
- Enter the following details:
- Dashboard Name: Provide a meaningful name.
- Description: (Optional) Add a brief explanation of the dashboard’s purpose.
- Folder: Choose a folder to organize your dashboard. Make sure you have appropriate permissions for the folder. If it is saved to the “Private Dashboards” folder, it will only be visible to you.
- Click Create.
- Add Widgets
- Click ‘+ Widget’.
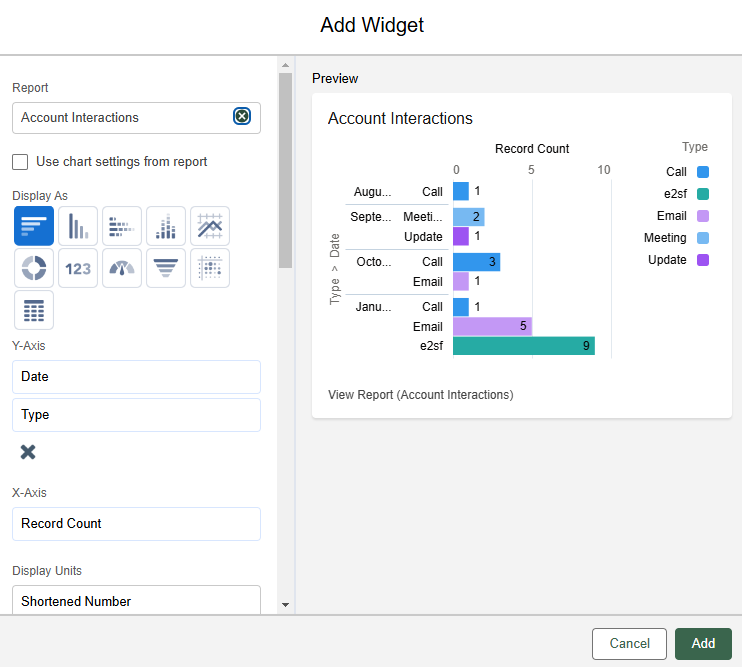
- Choose ‘Chart or Table’.
- Select a report as the data source for the widget.
- Choose a visualization type (e.g., bar chart, pie chart, gauge).
- Configure display properties, including title and axis settings.
- Click ‘Add’ to add the widget to the dashboard.
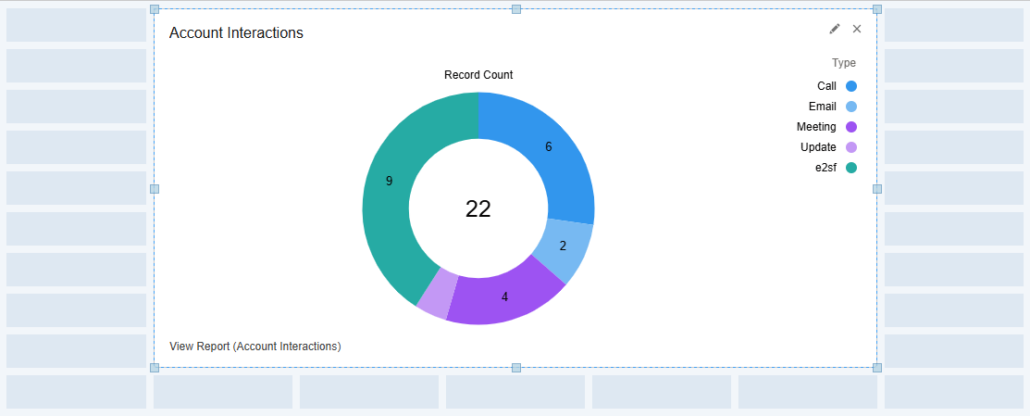
- Arrange Widgets
- Drag and drop widgets to organize the layout.
- Resize widgets by dragging their edges.
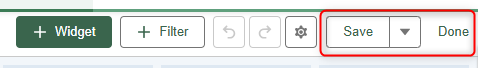
- Save and View
- Click ‘Save’ to store your dashboard.
- Click ‘Done’ to see the live data visualization.
Editing a Dashboard:
- Open the Dashboard
- Navigate to the Dashboards tab and locate the desired dashboard.
- Click on the dashboard name to open it.
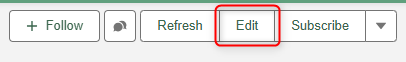
- Enter Edit Mode
- Click the Edit button.
- Modify Widgets
- To update a widget:
- Click on the pencil icon in the top right of the widget.
- Make changes to the data source, visualization type, or settings.
- Click Update.
- To rearrange or resize components:
- Drag and drop components to the desired position.
- To update a widget:
- Add or Remove Components
- To add new components, click + Component and follow the steps for adding components.
- To remove a component, click the X (Delete icon) on the component.
- Save Changes
- Click Save to preserve your edits.
Updating a Dashboard:
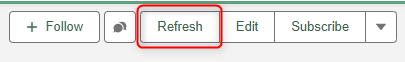
- Refresh Data
- Open the dashboard and click the Refresh button to update the data displayed in the components.
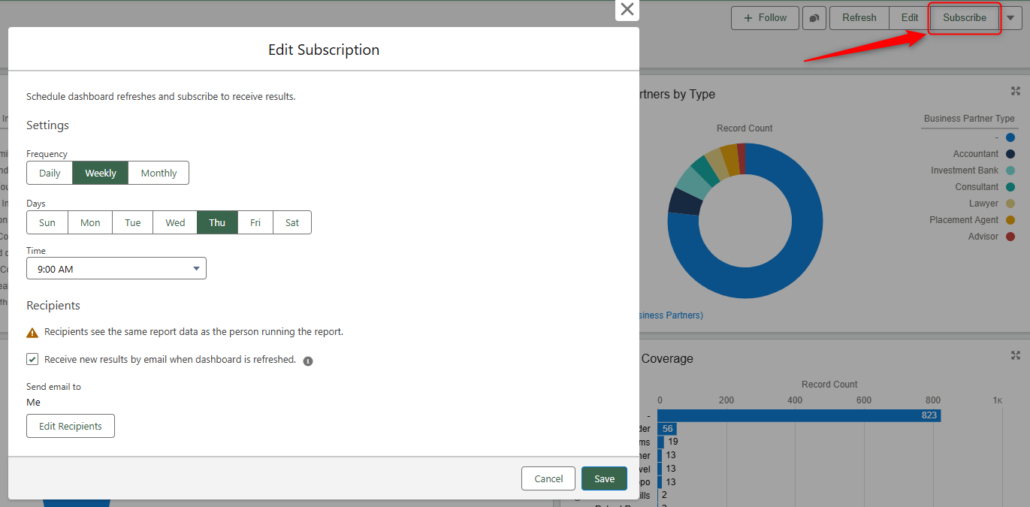
- Schedule Refreshes and Subscribe
- To automate data updates:
- Click Subscribe.
- Set the frequency (e.g., daily, weekly) and time.
- Specify recipients for emailed updates.
- Click Save.
- To automate data updates:
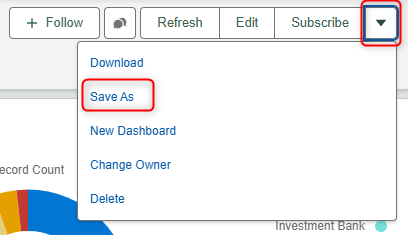
- Clone for Major Updates
- For significant changes, consider cloning the dashboard:
- Click the dropdown caret and select Save As.
- Enter a new name and folder.
- Edit the cloned dashboard without affecting the original.
- For significant changes, consider cloning the dashboard:
Limitations of Dashboards:
While CRM dashboards are powerful, they come with certain limitations:
- Component Limits
- Dashboards can contain a maximum of 20 components. If you need more, consider creating multiple dashboards.
- Data Refresh Frequency
- Automatic data refreshes are limited to once per hour. Real-time data visualization is not available.
- Complex Reports
- Dashboards rely on reports, and overly complex reports can slow down performance or lead to errors.
- Customization Constraints
- The layout and styling options are limited compared to third-party visualization tools.
- User Permissions
- Users need appropriate permissions to access certain folders, reports, or dashboards.
- Cross-Object Reporting
- Dashboard widgets cannot combine data from unrelated objects unless through custom solutions or third-party integrations.
Best Practices:
- Use Clear Titles and Labels: Ensure that dashboard components have intuitive names and descriptions.
- Limit Components: Avoid overcrowding. Use multiple dashboards if needed.
- Regularly Review: Periodically assess dashboards for relevance and accuracy.
- Optimize for Performance: Use summary reports and avoid overly complex queries.
By following these steps and best practices, you can effectively manage dashboards in the CRM, enabling better decision-making through data insights.
Was this helpful?
Thanks for your feedback!